w/c 14.11.22
National Traffic Volume
The stability in our audience numbers citywide and CBD over the last few months indicates that Aotearoa’s population has settled into their ‘usual’ routine after two years + of disruption.
All cities we report on are sitting at +/- 5% of the baseline, except for Tauranga, which saw a significant audience movement last week City Wide.
With the consistent stability of our audiences, the demand for this report has diminished; therefore, this week is the last report we will do for the foreseeable future.
Should you have questions on mobility in 2023, these sites may be helpful;
TomTom congestion insights - https://www.tomtom.com/traffic-index/auckland-traffic/
Google Mobility - https://www.google.com/covid19/mobility/
Tom Tom congestion gives you an idea of the time of day traffic etc., while the Google mobility data is good to show how mobility shifts at certain times of the year, e.g. Christmas, school holidays etc.
LMID Methodology overview:
Methodology overview:
Weekly reach change analysis uses the location events from 3rd August 2020 – 1st August 2021 to calculate an average week versus the respective week noted in the “w/c” time period.
Data Overview:
This dashboard is powered by LANDMARKS ID’s aggregated, de-identified and privacy compliant mobile location panel. All data is summarised from a statistically representative and nationally distributed panel of 300,000+ mobile devices.
Footfall visits to nominated points of interest are aggregated into Brand Insights (like McDonald’s, Countdown etc) and Industry Category Insights (like Shopping Malls, Quick Service Restaurants etc.).
Mobility Insights are summarised from the activity of devices as they travel about a city.
Reach is the number of unique people in the panel that completed a journey that week.
Audience is a measure of the total number of journeys made by people in the panel (Reach x Frequency) throughout a week.
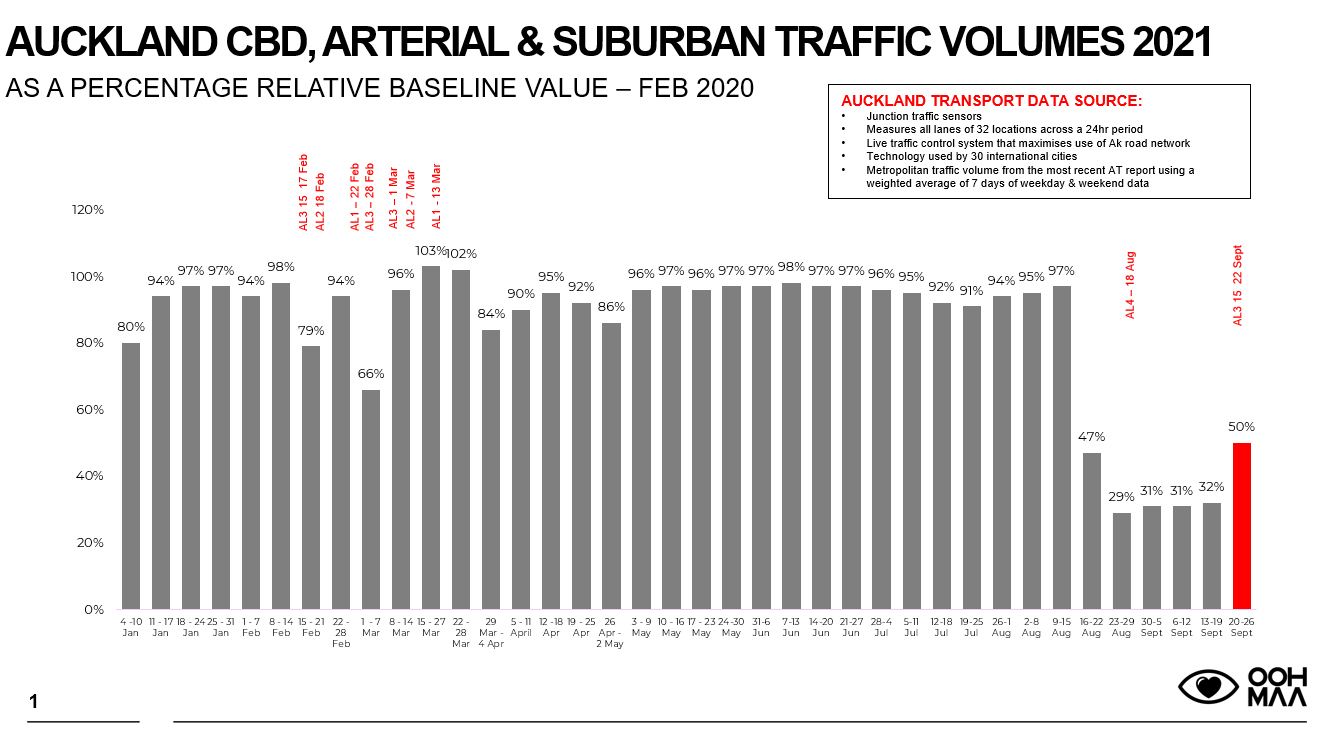
Data tracking the impact of Government restrictions due to COVID 2020 on the Auckland market can be found below. Please note this is information from Auckland Transport and full 2021 data isn’t available as tracking ended in October 2021.


